
Oscillograms are an important tool for monitoring and analyzing electrical systems.
They allow power grid operators and engineers to obtain information about temporal changes in the system, which helps optimize its operation and ensure power supply reliability.
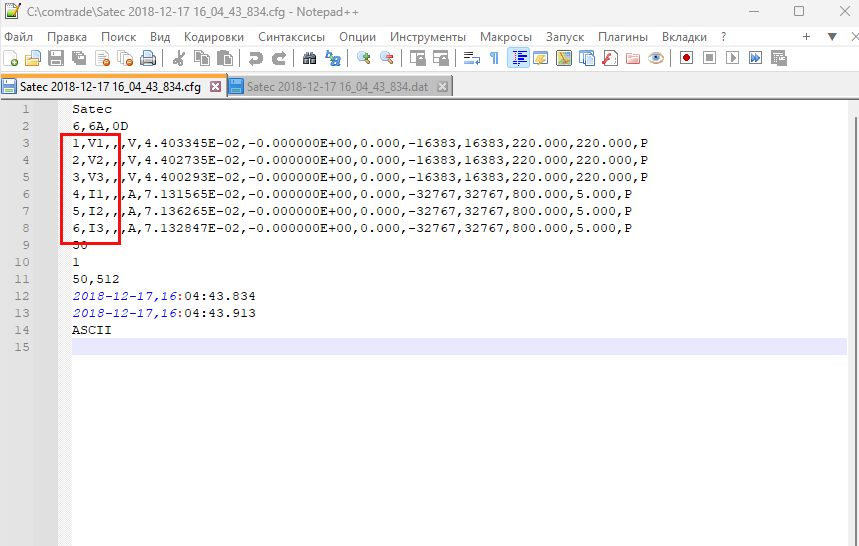
The main standard for oscillograms is the COMTRADEformat. According to this standard, an oscillogram consists of two files – a configuration file (cfg file), containing device parameters and the conditions under which the oscillogram was created, and a data file (dat file), which is a binary or ASCII file with normalized values of each channel's parameters at each measurement time point.
Fast View
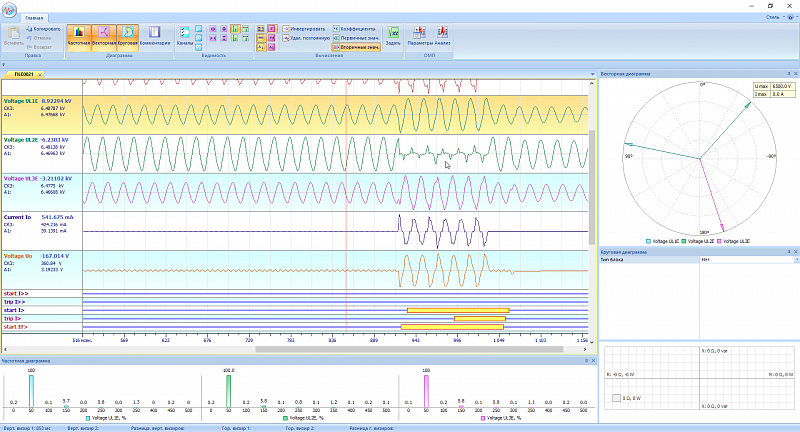
Oscillograms obtained from devices need to be processed. Application software must read the .cfg file, determine the recording start time and the fault moment, the list of analyzed channels and their parameters from it, then read the .dat file, convert normalized values to real ones, and display the oscillogram on the screen. Specialized software exists for analysis (both commercial and free). For example, the free program FastView.
Furthermore, relay automation devices and power quality analyzers can be used as part of a SCADA system – for continuous collection and processing of data from various sources, in which case integration of oscillograms into the system's general interface is necessary.
Integration into MasterSCADA 4D
MasterSCADA 4D allows easy reading and displaying of oscillogram data on a trend using the new Comtrade function block.
Let's consider displaying oscillogram data (alternating current strength and voltage) on a trend, read from a SATEC device.
FBD Configuration.
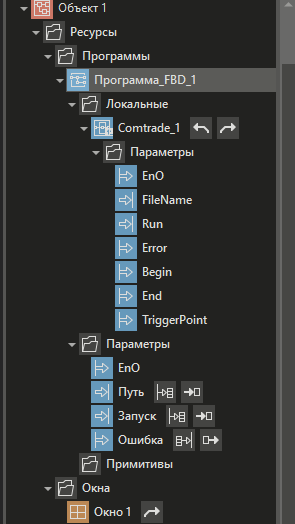
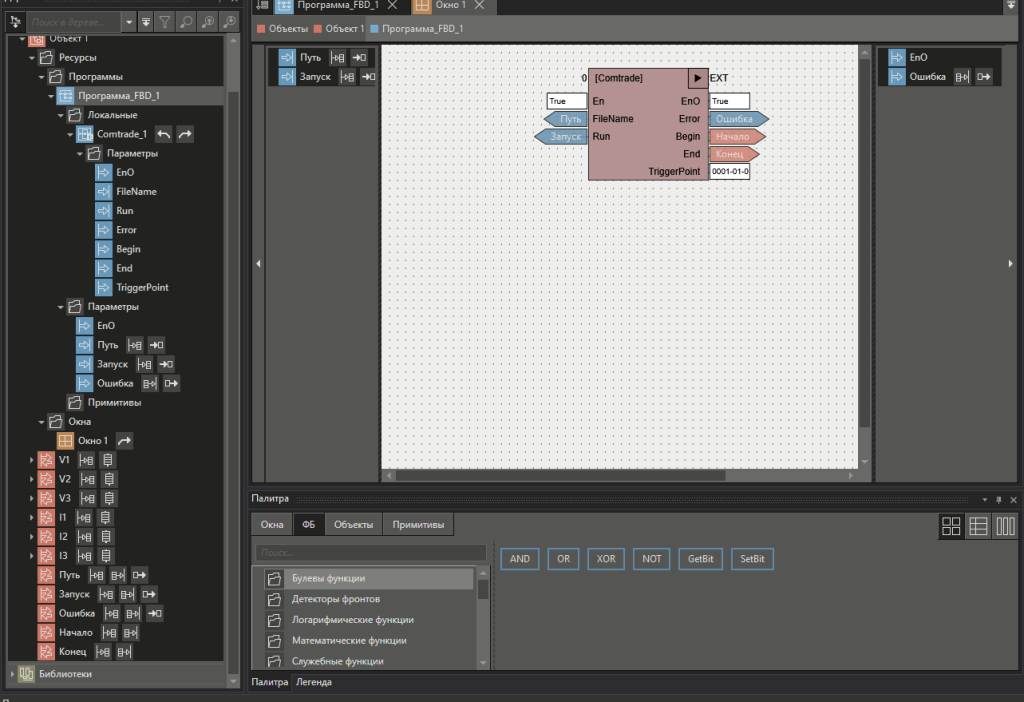
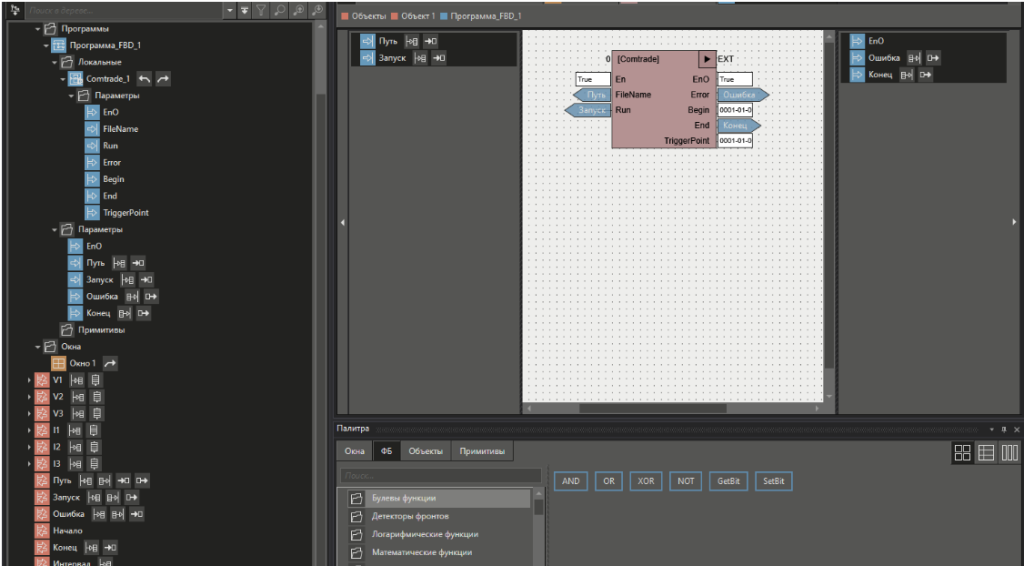
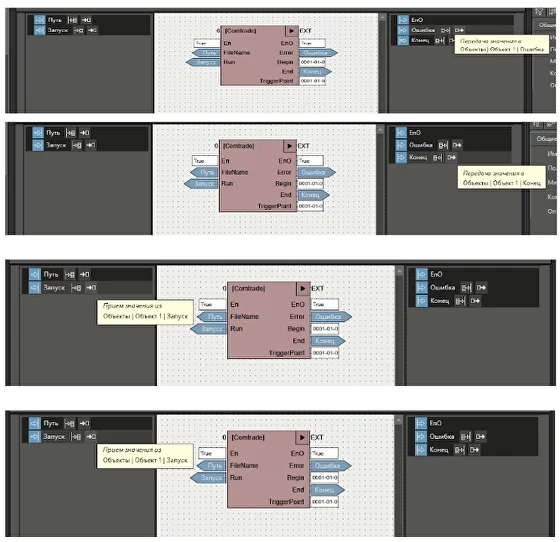
Create a new Objec → FBD Program. Then, in the FB library / Protocols, find the ФБ Comtrade and drag it into the previously created FBD. Also, add a window to the same object for displaying the Trend.
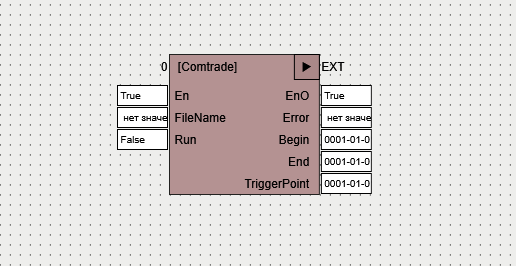
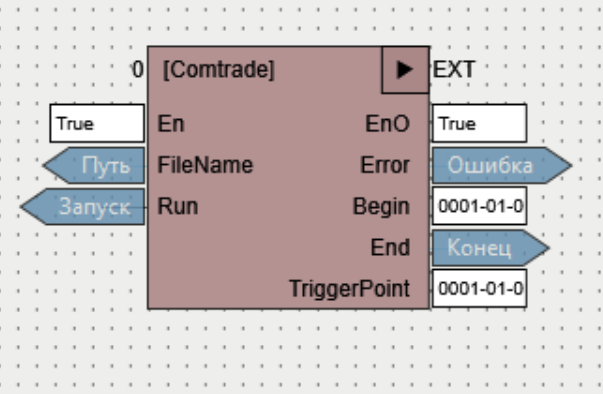
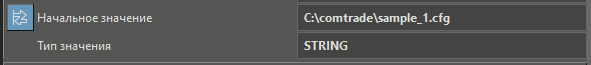
FileName - path to the configuration file (.cfg),
Run - start file reading.
Output parameters:
Begin, End, TriggerPoint - time parameters for reading the archive
Error - errors when reading the file.
Possible errors:
- Failed to open configuration file
- Failed to open data file
- Error in configuration file
- Error in data file
- Error in number of sampling frequencies (>1)
To read data, it is required to add parameters of type LREAL with the same names as the channel names in the .cfg file, in the same object to which the Comtrade FB belongs:
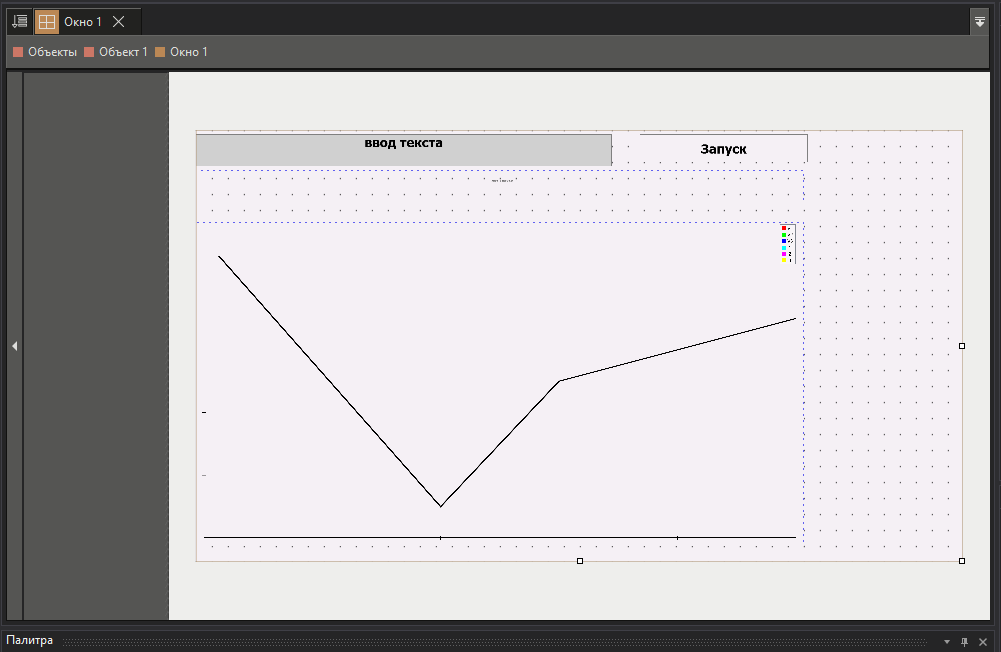
Place the Trend control in the previously prepared window, then bind the I1-3, V1-3 parameters created for reading data to it.
The pen graph type is selected as - Line.
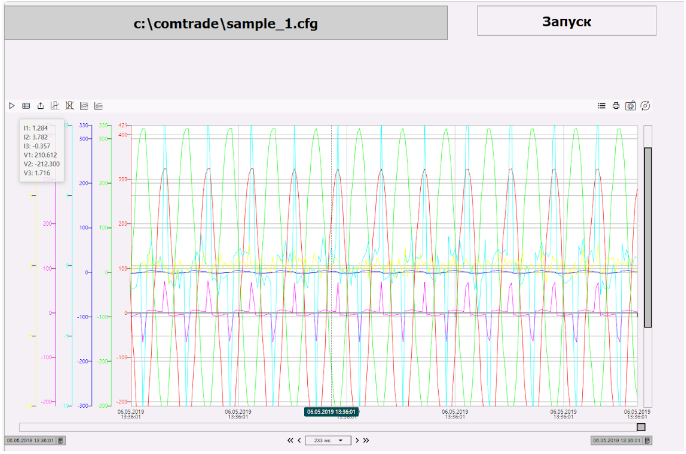
Execution.
Run the project in Runtime mode. Stop the Trend, press Start.
They allow power grid operators and engineers to obtain information about temporal changes in the system, which helps optimize its operation and ensure power supply reliability.
The main standard for oscillograms is the COMTRADEformat. According to this standard, an oscillogram consists of two files – a configuration file (cfg file), containing device parameters and the conditions under which the oscillogram was created, and a data file (dat file), which is a binary or ASCII file with normalized values of each channel's parameters at each measurement time point.
Fast View
Oscillograms obtained from devices need to be processed. Application software must read the .cfg file, determine the recording start time and the fault moment, the list of analyzed channels and their parameters from it, then read the .dat file, convert normalized values to real ones, and display the oscillogram on the screen. Specialized software exists for analysis (both commercial and free). For example, the free program FastView.
Furthermore, relay automation devices and power quality analyzers can be used as part of a SCADA system – for continuous collection and processing of data from various sources, in which case integration of oscillograms into the system's general interface is necessary.
Integration into MasterSCADA 4D
MasterSCADA 4D allows easy reading and displaying of oscillogram data on a trend using the new Comtrade function block.
Let's consider displaying oscillogram data (alternating current strength and voltage) on a trend, read from a SATEC device.
FBD Configuration.
Create a new Objec → FBD Program. Then, in the FB library / Protocols, find the ФБ Comtrade and drag it into the previously created FBD. Also, add a window to the same object for displaying the Trend.
FileName - path to the configuration file (.cfg),
Run - start file reading.
Output parameters:
Begin, End, TriggerPoint - time parameters for reading the archive
Error - errors when reading the file.
Possible errors:
- Failed to open configuration file
- Failed to open data file
- Error in configuration file
- Error in data file
- Error in number of sampling frequencies (>1)
To read data, it is required to add parameters of type LREAL with the same names as the channel names in the .cfg file, in the same object to which the Comtrade FB belongs:
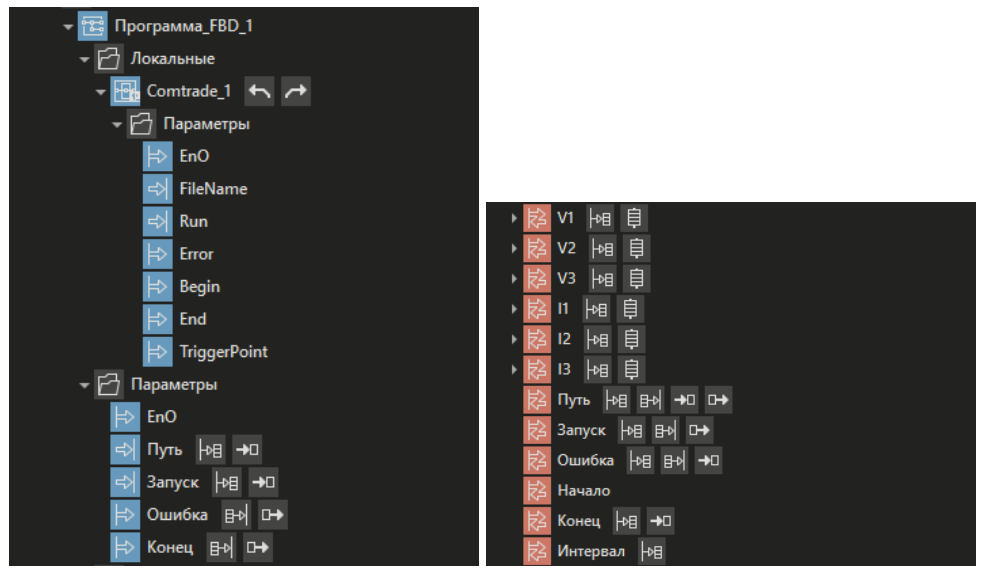
Place the Trend control in the previously prepared window, then bind the I1-3, V1-3 parameters created for reading data to it.
Link the End parameter to the trend's End property.
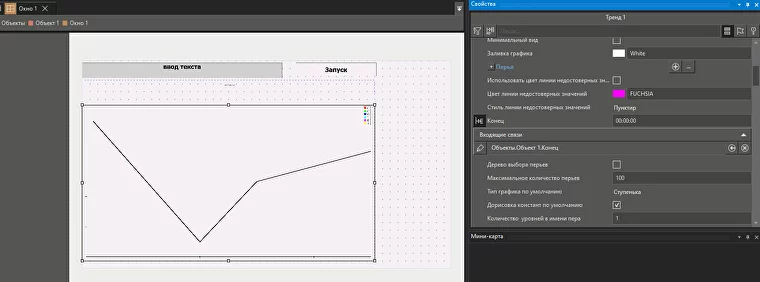
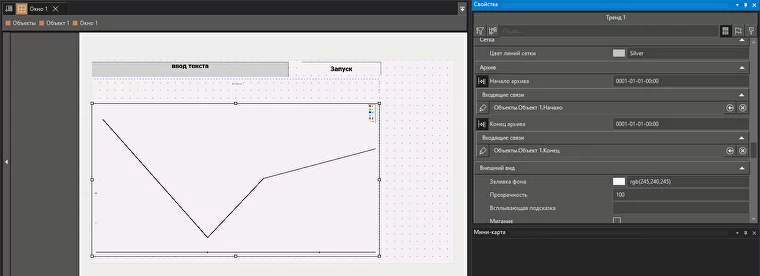
The pen graph type is selected as - Line.
Execution.
Run the project in Runtime mode. Stop the Trend, press Start.
Project link: https://support.mps-soft.ru/Site/Projects/oscillogram.zip
Обсуждение
Log in or register to participate in the discussion.